Financial Highlights For the years ended March 31
| Millions of Yen | |||||
| 2008 U.S. GAAP |
2009 U.S. GAAP |
2010 U.S. GAAP |
2011 IFRS |
2012 IFRS |
|
| Results of operations | |||||
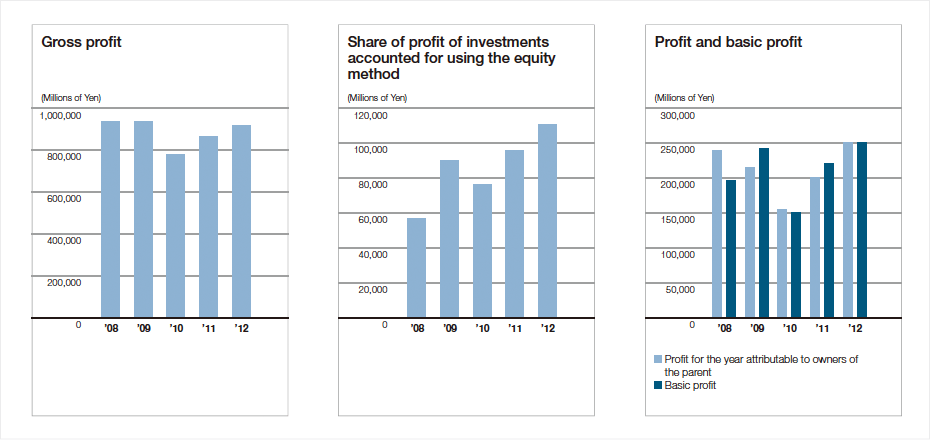
| Gross profit | ¥ 934,542 | ¥ 935,232 | ¥ 779,512 | ¥ 863,994 | ¥ 918,825 |
| Financial income (expense) | (27,578) | (21,487) | (12,773) | (8,079) | (3,862) |
| Interest expense, net | (42,838) | (36,120) | (24,070) | (18,090) | (15,056) |
| Dividends | 15,260 | 14,633 | 11,297 | 10,011 | 11,194 |
| Share of profit of investments accounted for using the equity method* | 56,942 | 89,954 | 76,132 | 95,580 | 110,628 |
| Profit for the year attributable to owners of the parent* | 238,928 | 215,078 | 155,199 | 200,222 | 250,669 |
| Financial position at year end | |||||
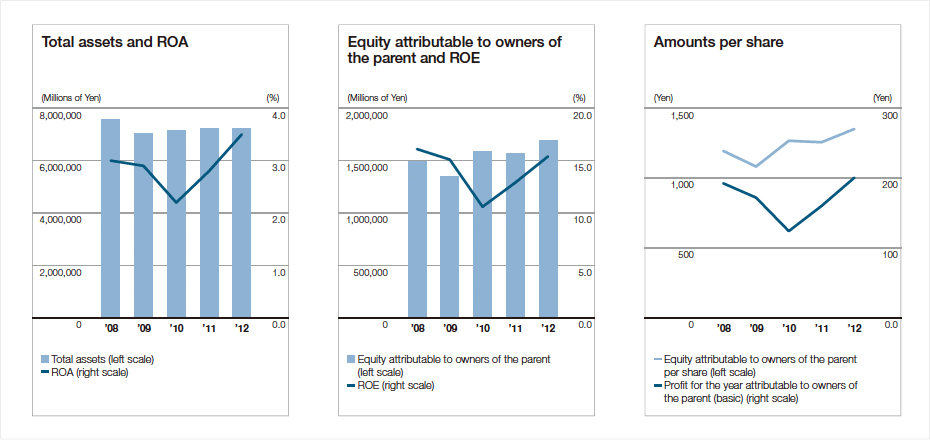
| Total assets | 7,571,399 | 7,018,156 | 7,137,798 | 7,230,502 | 7,226,769 |
| Equity attributable to owners of the parent* | 1,492,742 | 1,353,115 | 1,583,726 | 1,570,468 | 1,689,056 |
| Interest-bearing liabilities (net) | 3,247,556 | 3,186,833 | 2,781,791 | 3,056,256 | 2,786,655 |
| Cash flows | |||||
| Net cash from operating activities | 323,662 | 348,779 | 510,425 | 219,502 | 190,417 |
| Net cash used in investing activities | (298,041) | (261,517) | (59,381) | (469,378) | (35,696) |
| Free cash flows | 25,621 | 87,262 | 451,044 | (249,876) | 154,721 |
| Net cash (used in) from financing activities | 7,866 | (5,844) | (150,103) | 155,879 | (33,273) |

| Yen | |||||
| 2008 U.S. GAAP |
2009 U.S. GAAP |
2010 U.S. GAAP |
2011 IFRS |
2012 IFRS |
|
| Amounts per share | |||||
| Profit for the year attributable to owners of the parent* | |||||
| Basic | ¥ 192.51 | ¥ 172.06 | ¥ 124.15 | ¥ 160.17 | ¥ 200.52 |
| Diluted | 192.47 | 172.03 | 124.12 | 160.09 | 200.39 |
| Equity attributable to owners of the parent* | 1,194.20 | 1,082.47 | 1,266.93 | 1,256.31 | 1,351.10 |
| Cash dividends declared for the year*1 | 38.00 | 34.00 | 24.00 | 36.00 | 50.00 |
| %, Times | |||||
| Ratios | |||||
| Equity attributable to owners of the parent ratio (%)* | 19.7 | 19.3 | 22.2 | 21.7 | 23.4 |
| ROE (%) | 16.1 | 15.1 | 10.6 | 12.9 | 15.4 |
| ROA (%) | 3.0 | 2.9 | 2.2 | 2.8 | 3.5 |
| Debt-equity ratio (net) (times) | 2.2 | 2.4 | 1.8 | 1.9 | 1.6 |
| Millions of Yen | |||||
| For reference | |||||
| Total trading transactions*2, 3 | ¥11,484,585 | ¥10,749,996 | ¥7,767,163 | ¥8,349,371 | ¥8,273,043 |
| Basic profit*4 | 197,126 | 242,982 | 151,356 | 220,466 | 251,500 |
*1 Cash dividends per share represents the cash dividends declared applicable to each respective year, including dividends paid after the year-end.
*2 Total trading transactions is presented in a manner customarily used in Japan solely for Japanese investors' purposes.
*3 Total trading transactions represents the gross transaction volume of trading activities, or the nominal aggregate value of the transactions for which the Companies act as a principal or as an agent. Total trading transactions is a measure commonly used by Japanese trading companies. It is not to be construed as equivalent to, or a substitute for, sales or revenues under accounting principles generally accepted in the United States of America (U.S. GAAP) or IFRSs.
*4 Basic Profit = (Gross profit + Selling, general and administrative expenses (excluding provision for doubtful receivables) + Interest expenses, net + Dividends) x (1 – Tax rate) + Share of profit of investments accounted for using the equity method
<Tax rate was 41%>
