Financial HighlightsQuarterly
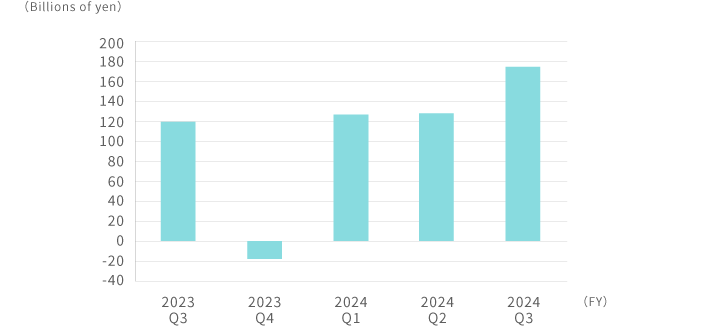
Profit (loss) for the period attributable to owners of the parent
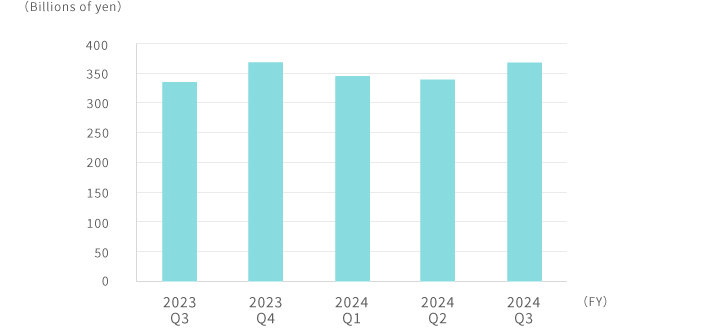
Gross Profit
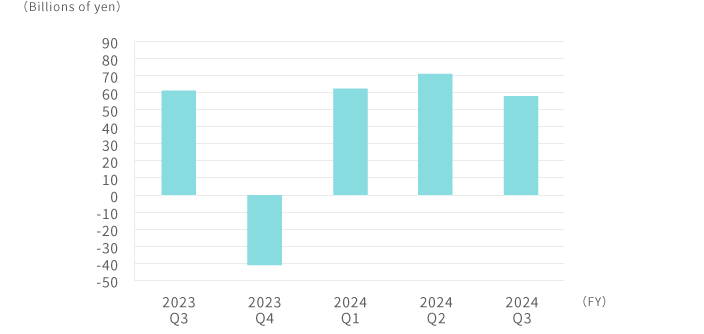
Share of profit (loss) of investments accounted for using the equity method
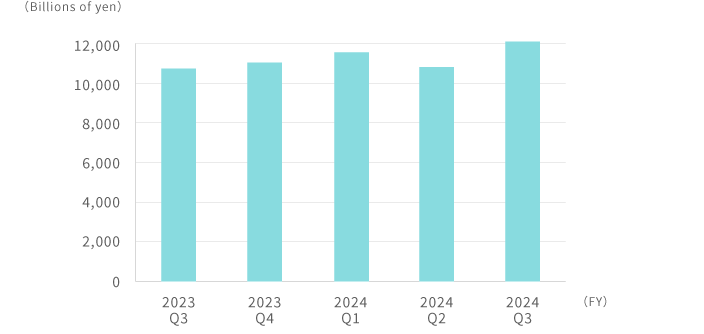
Total Assets
| (For the quarter) | FY2024 Q4 | FY2025 Q1 | FY2025 Q2 | FY2025 Q3 | FY2025 Q4 |
|---|---|---|---|---|---|
| Profit (loss) for the period attributable to owners of the parent | 145.4 | 170.9 | 130.4 | 107.2 | 191.9 |
| Gross Profit | 393.4 | 358.5 | 348.2 | 380.0 | 423.0 |
| Share of profit (loss) of investments accounted for using the equity method | 85.7 | 97.0 | 62.6 | 48.6 | 58.5 |
| Total Assets | 11,631.2 | 11,558.4 | 11,976.6 | 12,999.2 | 13,638.3 |