Financial HighlightsAnnual
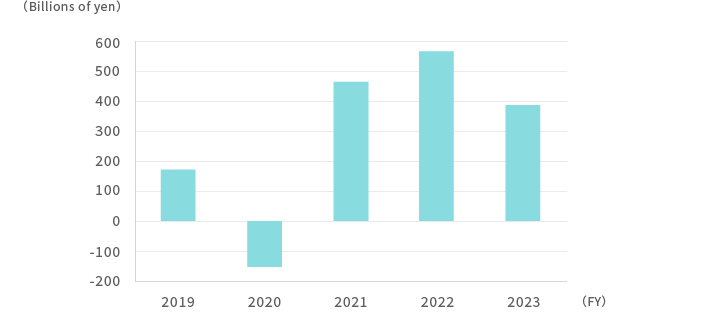
Profit (loss) for the year attributable to owners of the parent
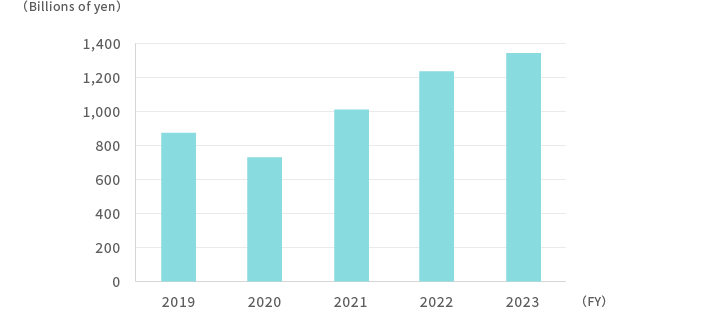
Gross Profit
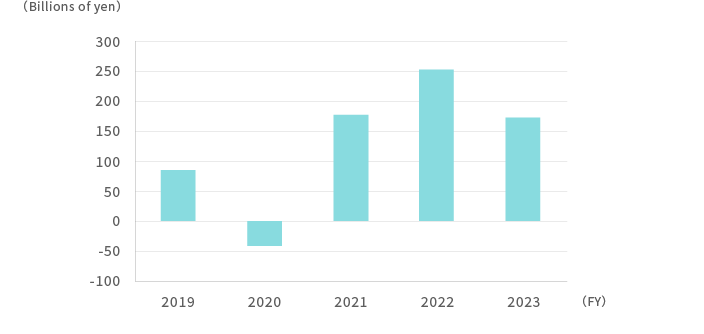
Share of profit (loss) of investments accounted for using the equity method
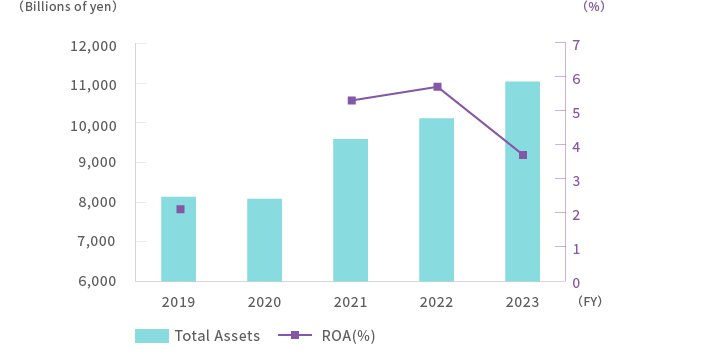
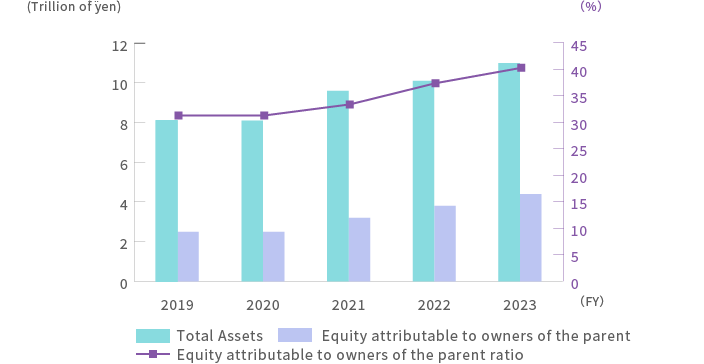
Total Assets, ROA
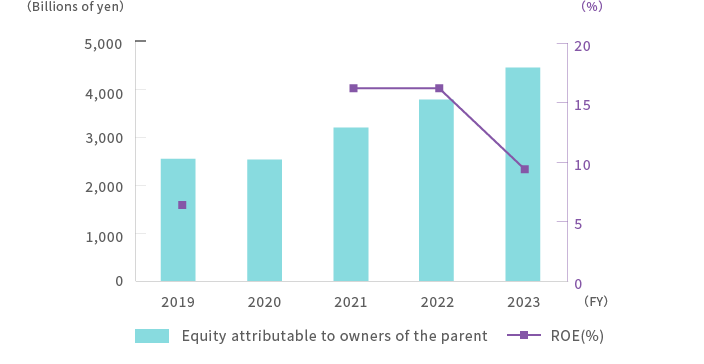
Equity attributable to owners of the parent, ROE
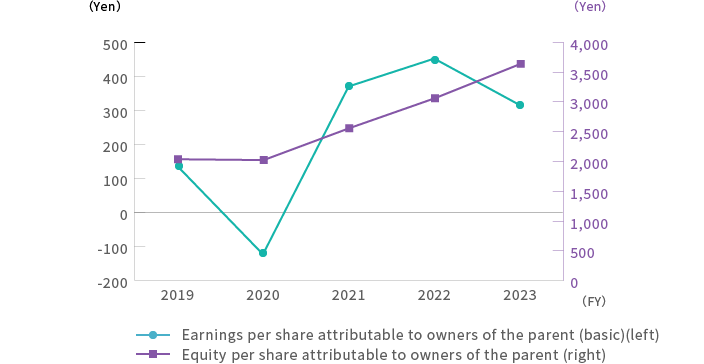
Earnings per share attributable to owners of the parent (basic) and Equity per share attributable to owners of the parent
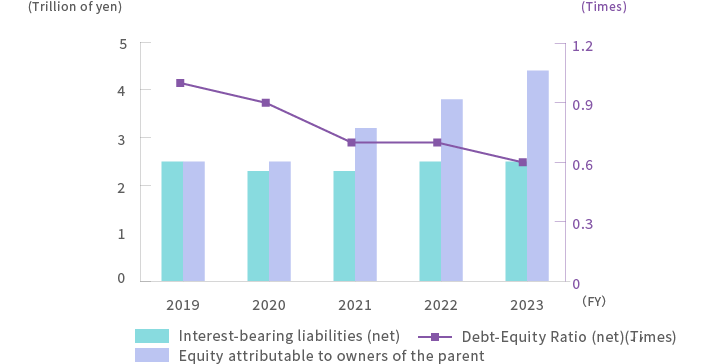
Net D/E Ratio (Times)
Equity attributable to owners of the parent ratio
| (For the years ended March 31) | 2021 | 2022 | 2023 | 2024 | 2025 |
|---|---|---|---|---|---|
| Gross Profit | 1,009.6 | 1,234.8 | 1,342.5 | 1,444.8 | 1,509.7 |
| Share of profit (loss) of investments accounted for using the equity method | 176.8 | 252.4 | 172.4 | 277.0 | 266.7 |
| Profit (loss) for the year attributable to owners of the parent | 463.7 | 565.3 | 386.4 | 561.9 | 600.3 |
| Total Assets | 9,582.2 | 10,105.4 | 11,032.6 | 11,631.2 | 13,638.3 |
| Equity attributable to owners of the parent | 3,197.8 | 3,778.7 | 4,445.5 | 4,648.5 | 4,628.6 |
| Interest-bearing liabilities (net) | 2,273.7 | 2,484.4 | 2,523.4 | 2,672.5 | 3,147.2 |
| Equity attributable to owners of the parent ratio (%) | 33.4 | 37.4 | 40.3 | 40.0 | 33.9 |
| ROE (%) | 16.2 | 16.2 | 9.4 | 12.4 | 12.9 |
| ROA (%) | 5.3 | 5.7 | 3.7 | 5.0 | 4.8 |
| Net D/E Ratio (Times) | 0.7 | 0.7 | 0.6 | 0.6 | 0.7 |
| Net cash provided by (used in) operating activities | 194.1 | 232.8 | 608.9 | 612.3 | 813.5 |
| Net cash provided by (used in) investing activities | 49.0 | -91.5 | -219.2 | -461.4 | -155.9 |
| Free cash flows | 243.1 | 141.3 | 389.6 | 150.9 | 657.6 |
| Net cash provided by (used in) financing activities | -139.9 | -250.5 | -415.5 | -247.4 | -252.5 |
| (For the years ended March 31) | 2021 | 2022 | 2023 | 2024 | 2025 |
|---|---|---|---|---|---|
| Earnings per share attributable to owners of the parent (basic) | 370.79 | 452.63 | 315.87 | 463.66 | 499.09 |
| Equity per share attributable to owners of the parent | 2,558.24 | 3,061.92 | 3,638.06 | 3,841.68 | 3,880.87 |