SPECIAL FEATURE 1 Medium-Term Management Plans
–Results of BBBO2014 and Overview of BBBO2017
In May 2013, the Sumitomo Corporation Group announced its vision of “What We Aim to Be in 2019, Our Centennial Year,” together with the “Be the Best, Be the One 2014” (BBBO2014) medium-term management plan. Under BBBO2014, we worked to thoroughly enhance the Group's earning power, and we were successful in reinforcing our earnings base, particularly with regard to non-mineral resource businesses. However, we were forced to record impairment losses centered on the upstream mineral resources and energy businesses, and we therefore failed to meet the quantitative targets of the plan. In April 2015, we launched a new medium-term management plan–“Be the Best, Be the One 2017” (BBBO2017)–which defines our intention to make Groupwide efforts to overcome issues and to outline a path toward the realization of what we aim to be.
What We Aim to Be in 2019, Our Centennial Year
–Based on Our Management Principles and Activity Guidelines–

- •We aim to be a corporate group that is recognized by society as meeting and exceeding the high expectations directed toward us, creating value that nobody else can match in ways befitting our distinctive identity.
- •We aim to build a solid earnings base and aim for an even higher level of profit growth while maintaining financial soundness.
1Results of BBBO2014
(Fiscal years 2013 and 2014)
Quantitative performance
In fiscal 2013, profit for the year (attributable to owners of the parent) amounted to ¥223.1 billion, falling below targets due in part to the recognition of an impairment loss of ¥27.7 billion on a coal mining project in Australia. Loss for the year (attributable to owners of the parent) of ¥73.2 billion was posted in fiscal 2014, due to the impacts of lower resource prices and impairment losses totaling ¥310.3 billion, which were recorded with regard to several large-scale projects, such as a tight oil development project in the United States.
| Quantitative Targets | ||
|---|---|---|
| FY2013 | FY2014 | |
| Consolidated Net Income (loss) | ¥240 billion | ¥270 billion |
| Risk-adjusted Return Ratio | Approx. 12% (each fiscal year) |
|
| Return on assets (ROA) | 3% or more (each fiscal year) |
|
| Results | |
|---|---|
| FY2013 | FY2014 |
| ¥223.1 billion | ¥(73.2) billion |
| 10.9% | − |
| 2.7% | − |
Qualitative performance
Under BBBO2014, we worked to thoroughly enhance our earning power by stimulating the metabolism of our business portfolio through means such as making the existing earnings pillars even more robust, achieving greater value for existing investment projects, fostering and developing new pillars of earnings for the future, and replacing assets. As a result, we were able to reinforce our earnings base centered on non-mineral resource businesses. In addition, we established the Special Committee on Managerial Reform to address the impairment loss issue, and this committee provided the Company with advice on how to improve corporate value. In consideration of this advice and reflections on past events, the Company has determined the areas in which it will pursue improvement.
![]()
- •Strengthening risk management for upstream mineral resources and energy businesses
- •Improving profitability of our existing businesses
- •Achieving steady profitability after implementing business investments
- •Exercising integrated corporate strength across our organization through cooperation between organizations
- •Regaining the balance between Core Risk Buffers and Risk-adjusted Assets and enhancing cash-generation capabilities
New Medium-Term Management Plan, “Be the Best, Be the One 2017”
To make Groupwide efforts in overcoming issues and to outline a path
toward the realization of “What We Aim to Be”
2Overview of BBBO2017
(Fiscal years 2015 to 2017)
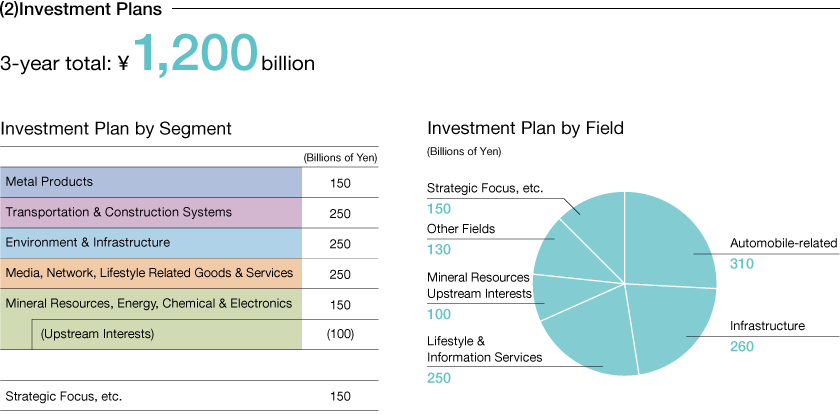
BBBO2017 is based on the theme of making Group-wide efforts to overcome issues and outlining a path toward the realization of what we aim to be. The plan will therefore guide us as we advance managerial reforms and growth strategies through the following three basic policies:
- · Overcome issues and execute managerial reforms
- · Strengthen earning power to realize “What We Aim to Be”
- · Regain the balance between Core Risk Buffers and Risk-adjusted Assets and achieve positive free cash flow (post-dividend, three-year total)
Promote managerial reforms
Improve corporate governance and decision-making process
- Upgrade decision-making process in business management
- Strengthen the supervisory functions of the Board of Directors
- Respond to the Corporate Governance Code
Strengthen risk management system
- Upgrade decision-making process on investments
- Review methodology of investment assessment and framework of investment execution
- Strengthen risk management for upstream mineral resources & energy projects
Promote Growth Strategies

Continue to strengthen structure to develop businesses in industries and regions with high growth potential from medium-to-long-term basis
Special Feature 2: Expanding Retail Businesses in Asia
| Industrial focus |
|---|
| Energy-related business Retail business in Asia Food and agriculture-related business |
| Regional focus |
|---|
| Brazil, India, Myanmar, Turkey, Sub-Saharan Africa |
Policy for the upstream mineral resources & energy business
| Policy: Improvement of the asset quality for the upstream mineral resources & energy business |
|---|
|
| Reconstruction of the upstream mineral resources & energy strategies |
|---|
|
Secure financial soundness
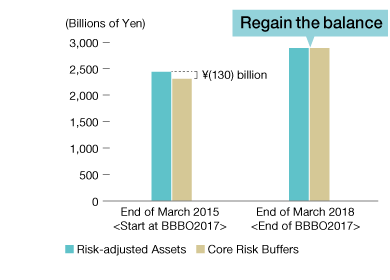
In regard to the basic policies of BBBO2017, the balance between Core Risk Buffers and Risk-adjusted Assets represents the basis for management, and regaining this balance will be a top priority. Moreover, we aim to achieve positive free cash flow in terms of the three-year, postdividend total. To accomplish this objective, we intend to finance investments and dividend payments by utilizing cash generated through business activities and asset replacement.
In each year of the plan, we will attempt to keep free cash flow within the range between a positive and negative &100.0 billion.
Regain the balance between Core Risk
Buffers and Risk-adjusted Assets
Achieve positive free cash flow
(post-dividend, three-year total)
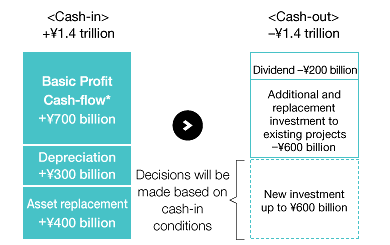
* Basic Profit Cash Flow = Basic Profit – Share of profit of investments accounted for using the equity method + Dividends from investments accounted for using the equity method
Basic Profit = (Gross profit + Selling, general and administrative expenses (excluding provision for doubtful receivables)
+ Interest expense, net of interest income
+ Dividends) x (1 . Tax rate) + Share of profit of investments accounted for using the equity method
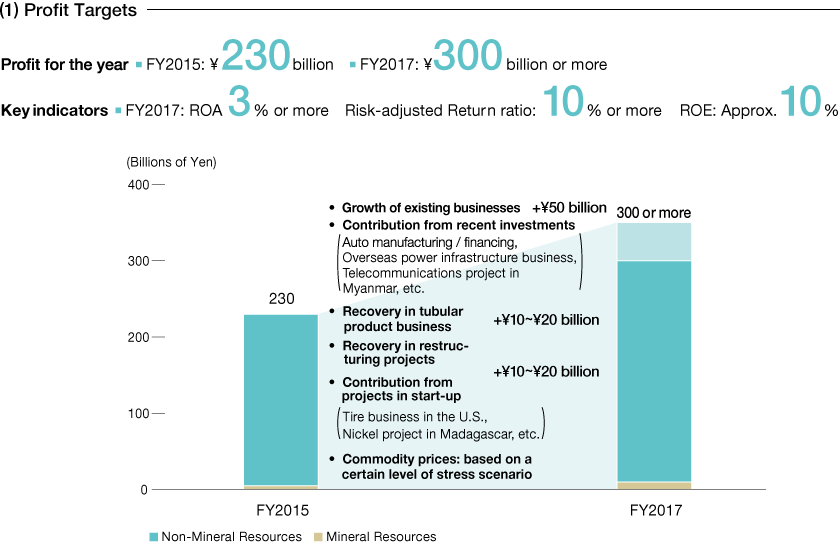
Quantitative Performance Targets
Dividend Policy
| Base Policy | Aim to increase dividends by achieving medium- and long-term earnings growth while adhering to fundamental policy of paying shareholders a stable dividend over the long term |
|---|
| BBBO2017 Dividend Policy |
We will decide dividend amount in view of the situations regarding basic profit and cash flow, with ¥50 per share as the minimum amount of annual dividend and a consolidated payout ratio of 25% or more as reference |
|---|
| Annual Dividend for FY2015 |
Projected to be ¥50 per share (Interim ¥25 per share, Year-end ¥25 per share) |
|---|
Key Financial Indicators in BBBO2017
| Start of BBBO2017 (Results as of Mar. 31, 2015) |
End of BBBO2017 (Forecasts as of Mar. 31, 2018) |
|
|---|---|---|
| Profit (Loss) for the Year | ¥(73.2) billion | ¥300.0 billion or more |
| Total Assets | ¥9,021.4 billion | ¥10.0 trillion |
| Shareholders' Equity | ¥2,481.4 billion | ¥3,100.0 billion |
| Shareholders' Equity Ratio | 27.5% | 31.0% |
| Interest-bearing Liabilities (Net) | ¥3,517.5 billion | ¥3,500.0 billion |
| DER (Net, times) | 1.4 times | Approx. 1.1 times |
| ROA | 2-year average 0.9% | FY2017 3.0% or more |
| ROE | 2-year average 3.2% | FY2017 Approx. 10.0% |
| Risk-adjusted Return Ratio | 2-year average 3.5% | FY2017 10.0% or more |
| Basic Profit Cash Flow | 2-year total ¥400.0 billion | 3-year total ¥700.0 billion |
| Free Cash Flow | 2-year total ¥(127.5) billion | 3-year total ¥200.0 billion |
| Risk-adjusted Assets [RA] Core Risk Buffers [RB] (Core RB-RA) |
¥2,450.0 billion ¥2,320.0 billion (130.0) |
¥2,900.0 billion ¥2,900.0 billion (Regain balance) |

